Mapping Unstable Ventricular Tachycardia
The incidence of sudden cardiac death is estimated to be in the range of 180,000-250,000 cases per year.1 Nonischemic cardiomyopathy causes approximately one-third of all cases of heart failure.2 Catheter ablation of ventricular tachycardia (VT) in patients with nonischemic cardiomyopathy can be challenging, and success rates are modest, with a 68% freedom from VT recurrence rate at 1 year.3 Oftentimes, failure of catheter ablation in nonischemic patients is due to predominance of epicardial scar and ineffective ablation from an endocardial-only approach.4
There have been several prior publications highlighting strategies of how to map VT.5-8 Tung also described a technique of strategic multielectrode positioning (StaMP mapping) prior to induction of an unstable VT.9 This case presentation highlights a good example of the importance of carefully analyzing electrograms and substrate maps prior to induction of VT to minimize the hemodynamic strain of mapping unstable VT.
Case Presentation
Our patient is a 44-year-old male with nonischemic cardiomyopathy with an ejection fraction (EF) of 40% with recurrent VT despite antiarrhythmics. He had previously been on amiodarone but experienced side effects. He was then started on dofetilide, but continued to have breakthrough episodes of VT, so mexiletine was added. However, he continued to have VT terminated by antitachycardia pacing and shocks, so he was referred for ablation. Of note, he would have syncope with his episodes of VT, suggesting low blood pressure during episodes. A cardiac magnetic resonance imaging scan was performed but did not show any areas of delayed enhancement, and confirmed an EF of 40%.
The patient was brought to the electrophysiology lab and kept under conscious sedation. General anesthesia was avoided to maximize chances of inducibility and minimize hemodynamic compromise. His defibrillator was interrogated, and all prior treated VT episodes were examined to determine how many potential morphologies and tachycardia cycle lengths were present. Using a can-RV coil vector, limited template and cycle length matching can be done to any induced VT during the case to determine which induced VT might be the most clinically relevant arrhythmia. In the absence of a 12-lead electrocardiogram of the patient’s VT, this technique can be used to identify the clinical VT during ablation.
Groin access was obtained in the usual fashion. Diagnostic catheters and a ViewFlex ICE catheter (Abbott) were placed to show a trivial baseline pericardial effusion. A combined epicardial/endocardial approach was planned given the patient’s nonischemic etiology, since up to 77% of nonischemic cardiomyopathy patients have epicardial portions of their VT circuit.10 In these scenarios, the preference is to obtain epicardial access and perform epicardial mapping prior to administration of anticoagulation for the endocardial portions of the procedure. This reduces potential bleeding complications from epicardial access, yet still retains the ability for simultaneous epicardial and endocardial mapping.
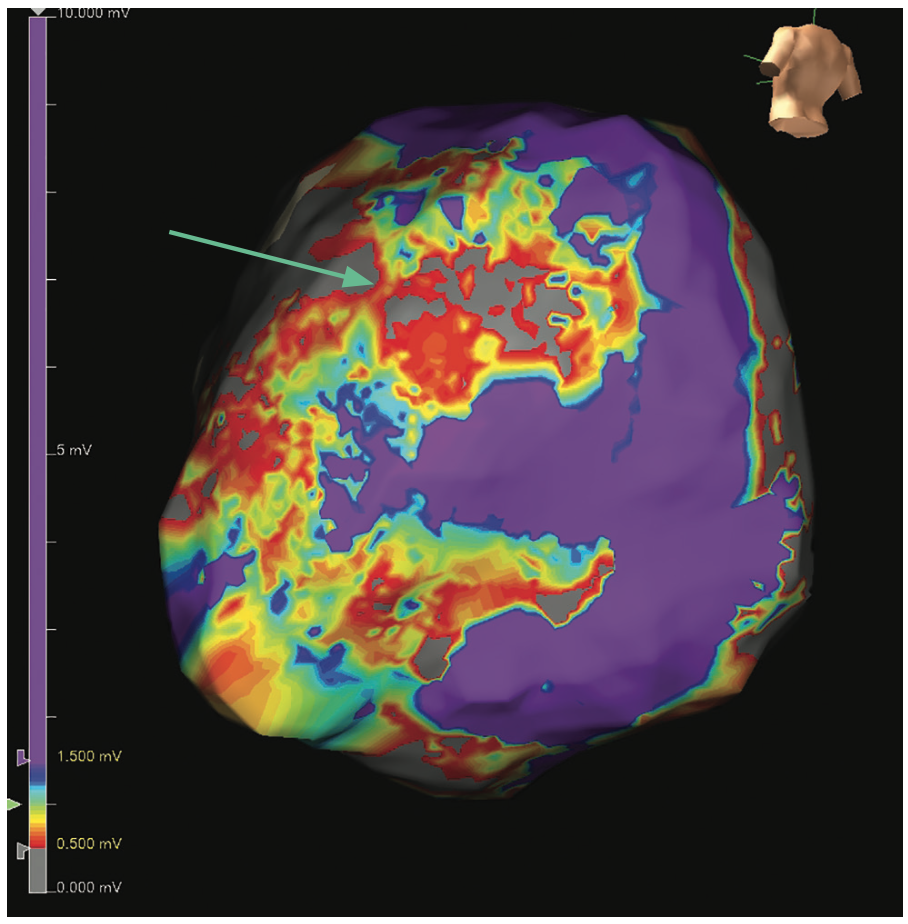
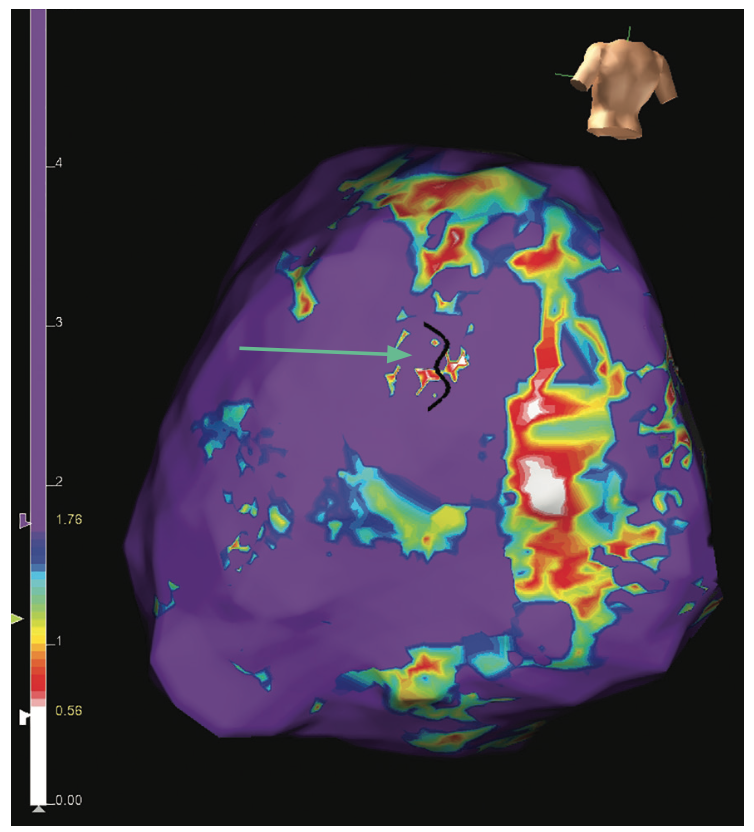
Epicardial access was obtained with a 12 cm micropuncture needle (Cook Medical). An 8 French Pinnacle sheath (Terumo) was placed into the pericardial space. A baseline epicardial voltage map was created using an Advisor HD Grid Mapping Catheter, Sensor Enabled (Abbott) and EnSite X EP System (Abbott) (Figure 1). The map showed an epicardial voltage bridge (green arrow) in the middle of 2 regions of more dense scar.
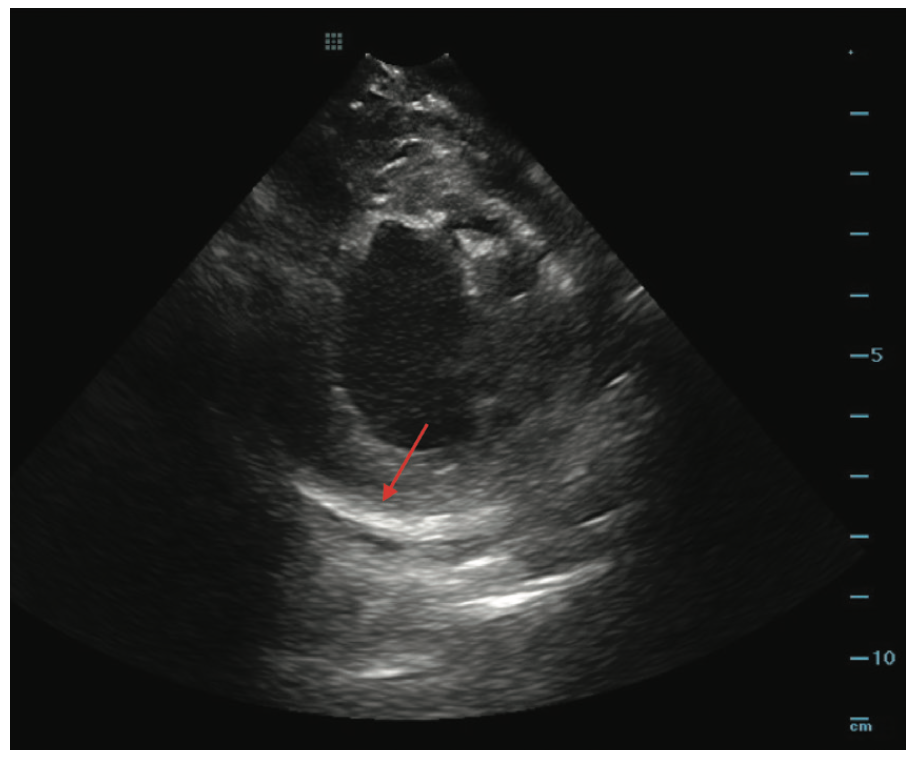
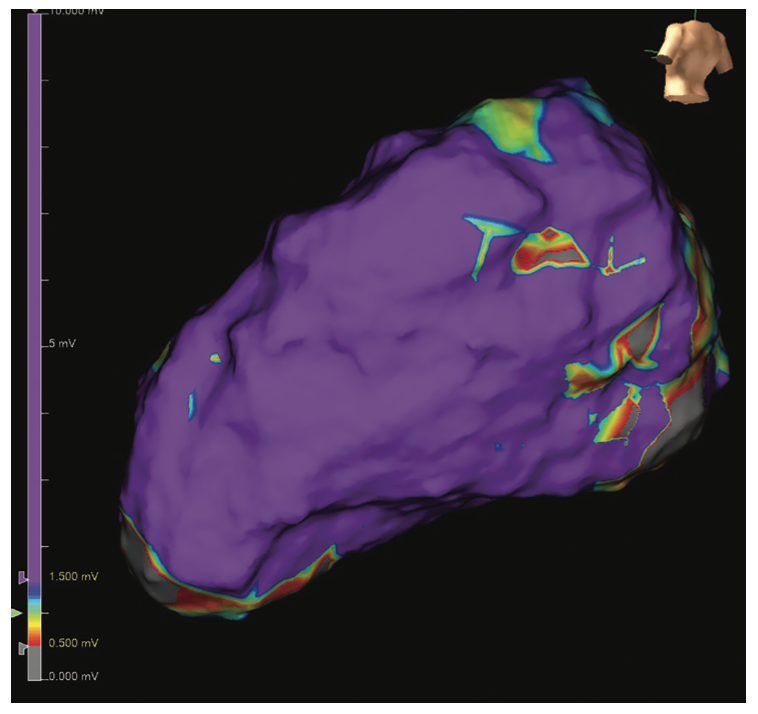
Intracardiac echocardiography (ICE) was used to visually identify areas of myocardial thinning, akinesis, and increased echogenicity, suggestive of prior infarct. In this case, ICE suggested epicardial scar in the lateral left ventricle (LV) (Figure 2).
While mapping the substrate, late potentials (LPs) and local abnormal ventricular activation (LAVA) signals were marked using location tags. A bipolar voltage map was created, annotating the last deflection. The omnipolar voltage map was then reviewed to delineate cleaner low-voltage borders. Once the voltage map was complete, the activation annotating the last deflection was viewed as a propagation map or sparkle map on the EnSite X system. This can show slow conduction through a channel, even during sinus rhythm. (Video 1)
Video 1. Sinus rhythm sparkle map overlayed on top of the omnipolar voltage map, showing the conduction is delayed over the low-voltage channel.
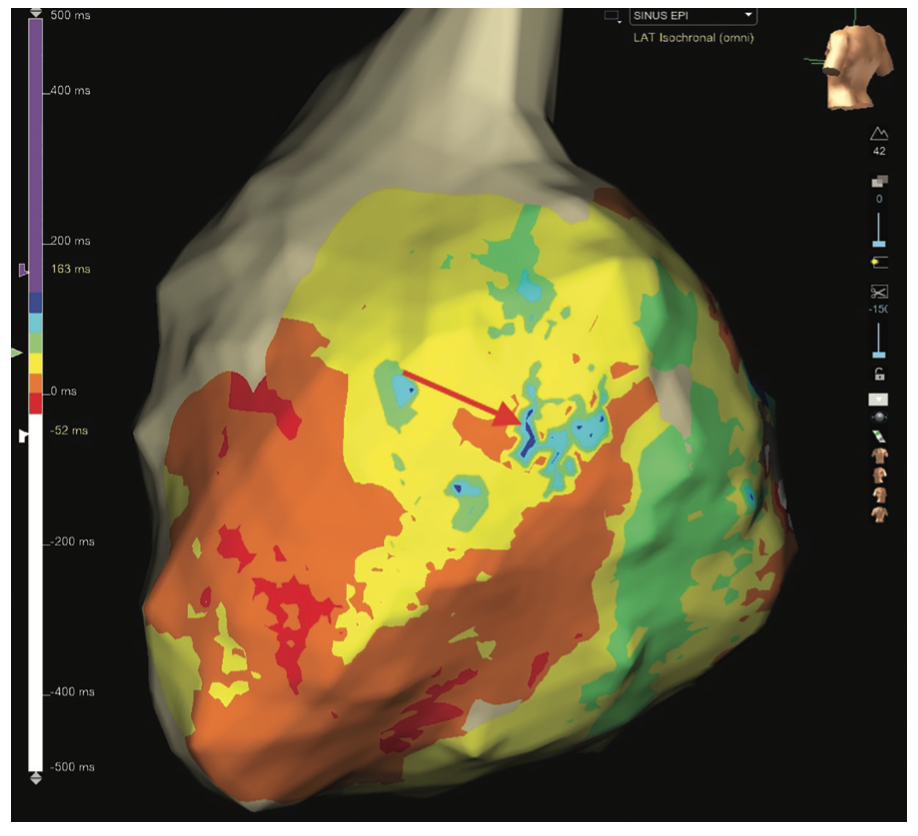
Omnipolar vector maps can highlight areas of rotational activation and slow conduction. The isochronal late activation map (ILAM) can show areas of crowding and deceleration zones, suggestive of entry into diseased channels (Figure 3).
A map analyzing the wave speed can also highlight areas of slow conduction; the white regions are areas of slow conduction and the purple areas are fast conduction. This map can help reveal channels of varying conduction velocity, suggestive of a potential setup for reentry (Figure 4).
All of these maps are individually analyzed in the context of the voltage map to determine the most pertinent areas of the patient’s scar. Transseptal access was then obtained and an endocardial voltage map of the LV was created with the Advisor HD Grid. This showed normal voltage with no areas of LPs or LAVAs (Figure 5). All of the interesting signals were in the epicardial lateral LV.
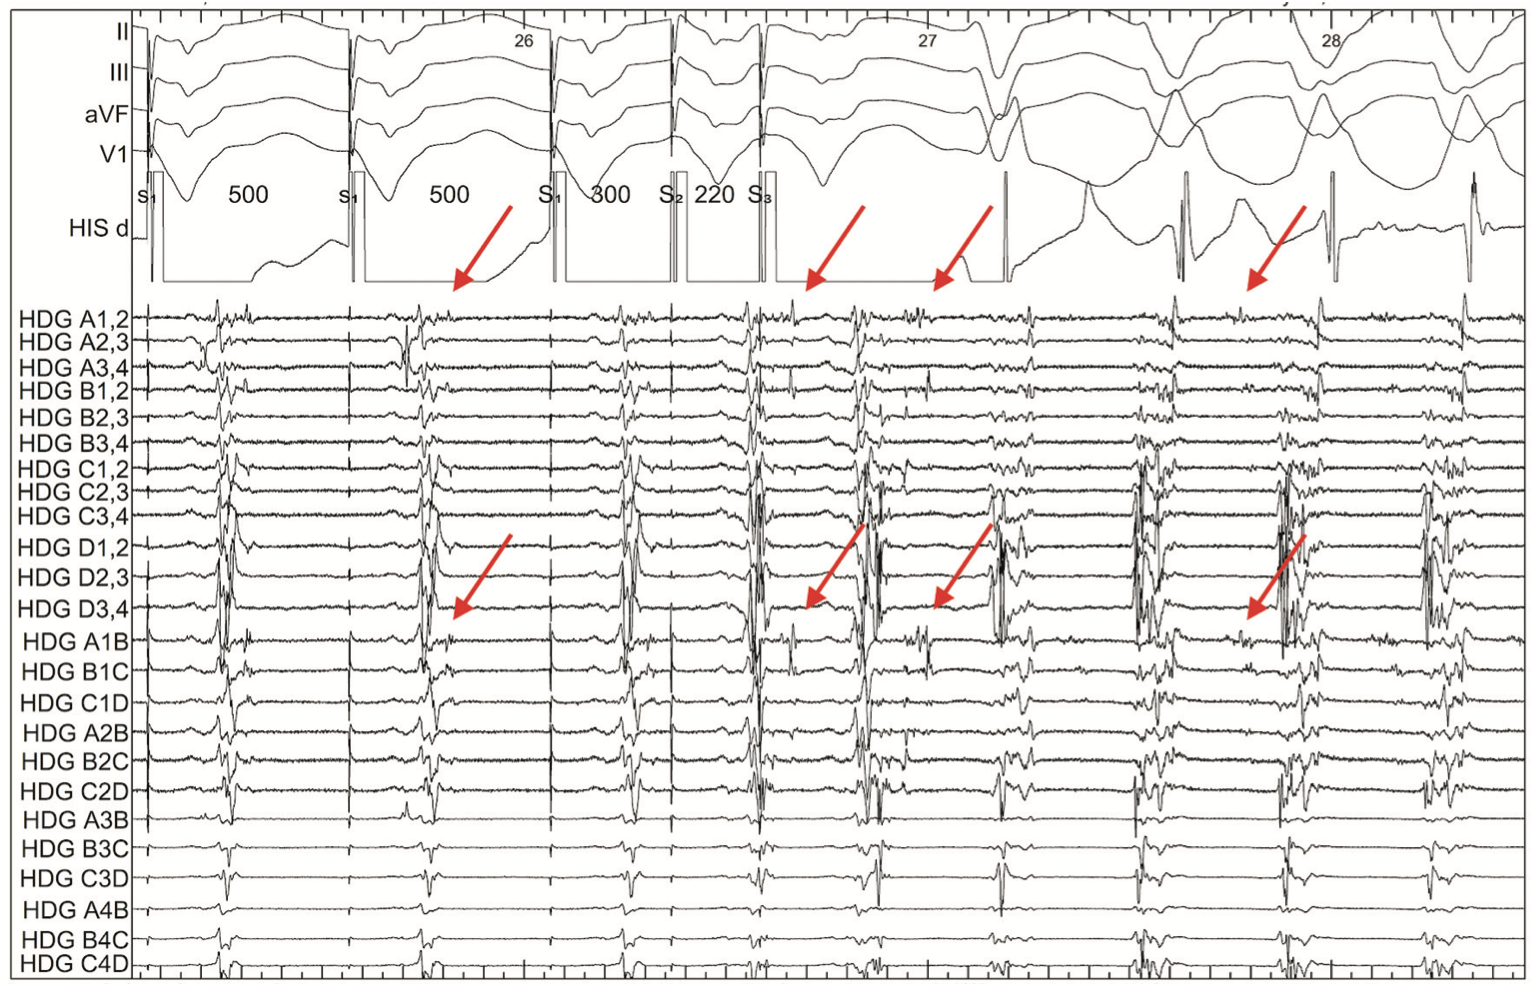
The Advisor HD Grid was then placed back in the epicardium in an area of interesting LPs while induction was attempted. VT was induced with double ventricular extrastimuli at 500-300-220. Using the Advisor HD Grid, an activation map was created of this right bundle/right superior axis VT with a tachycardia cycle length of 360 ms. Analysis of the induction of VT showed the interesting LP decrement during ventricular extrastimuli. Identification of these decrement evoked potentials (DEEP) has been demonstrated to be more specific for a critical isthmus than LP-only mapping.11,12 In this example, the decremental signals then become mid-diastolic signals during VT, revealing the critical isthmus within limited mapping during this hemodynamically unstable VT (Figure 6). Signals such as these are the essence of substrate mapping for VT.
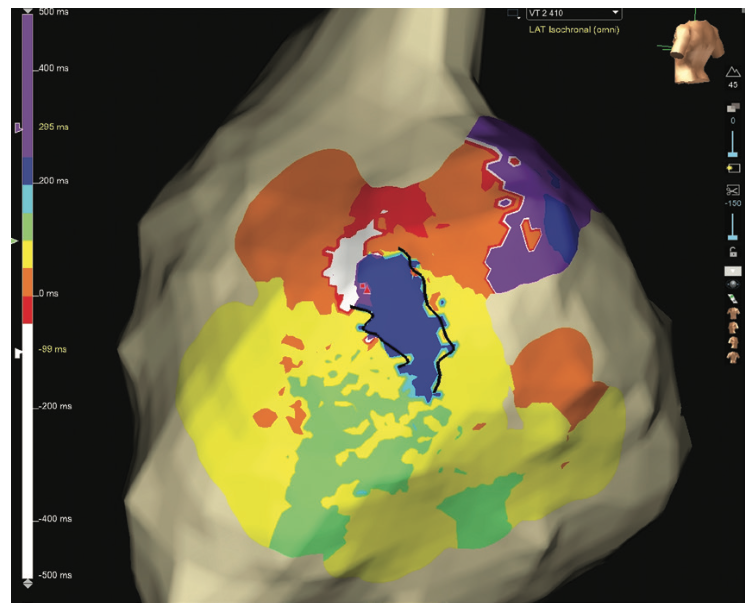
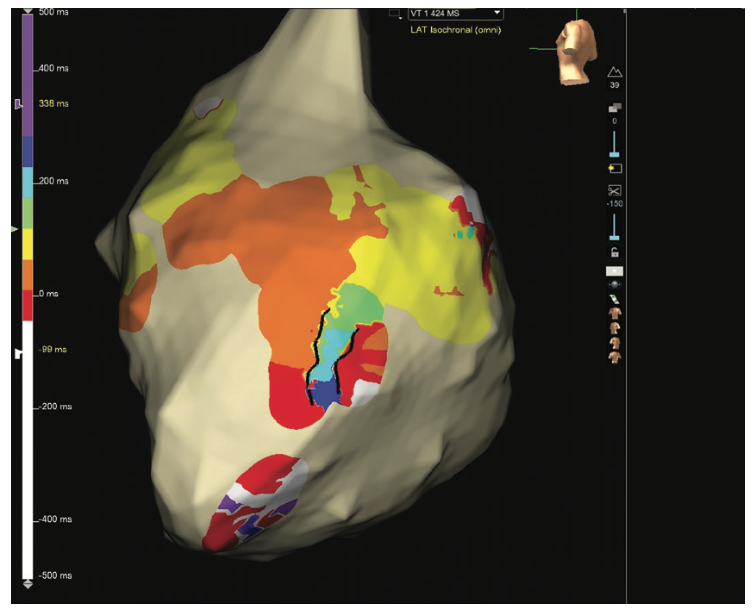
This VT was hemodynamically not well tolerated despite a background use of pressors, so detailed entrainment mapping was not practical. A limited activation map was created with the Advisor HD Grid positioned in the area of interest, revealing the critical isthmus (Figure 7). The VT was pace terminated to allow the patient to recover hemodynamically. (Video 2).
Video 2. Limited inverse propagation map of VT 1. The black lines show the boundaries of the critical isthmus.
The VT map was then analyzed and the area of the critical isthmus was correlated to the region of slow conduction on the wave speed map, isochronal stacking on the ILAM map, the low-voltage bridge on the sinus voltage map, and the areas of LPs that decremented to become mid-diastolic signals on the electrograms.
Reinduction was then attempted to gather more data on the activation map, but a different VT was induced. This VT was also not well tolerated hemodynamically, but limited mapping in the same region showed a circuit utilizing a similar isthmus, just in reverse (Figure 8, Video 3).
A 3.5 mm TactiCath Contact Force Ablation Catheter, Sensor Enabled (Abbott) was used to target this region. The coronary arteries were injected and marked on the map to ensure safe distance. Pacing was also performed to locate and avoid injury to the phrenic nerve. Ablation was started at 35W and titrated up to 45W to achieve a 10-20 ohm impedance drop and local signal reduction. This area was ablated until the region was no longer able to be captured with pacing at 10 mA at 2 ms. ICE is also used during each ablation to visualize contact and notice increasing echogenicity from a good ablation lesion. With TactiCath, the nominal low flow rate is 17 mL/min and with higher power increases to 30 mL/min. The preference is to keep this at 17 mL/min, even at higher power, to reduce fluid delivery to the patient, unless the catheter temperature is limiting adequate power delivery. If temperature is limiting, we temporarily increase back to 30 mL/min at higher power, then reduce it again when ablating in a different region with better blood flow. Half normal saline is also frequently used as the irrigant through the ablation catheter to improve energy delivery to the myocardium. Further ablation was performed throughout this scar region to consolidate. Ablation was performed targeting information from the ILAM and wave speed maps, in addition to other LPs and LAVA signals that were seen during the substrate mapping.
Video 3. Limited inverse propagation map of VT 2. The black lines show the boundaries of the critical isthmus.
After ablation, VT was no longer inducible despite ventricular burst pacing, triple ventricular extrastimuli, and use of isoproterenol. After epicardial ablations, 125 mg of methylprednisolone mixed with 5 cc lidocaine is injected into the pericardial space and left to dwell for 10-15 minutes to reduce pericarditis. All fluid is then removed prior to removing the pericardial drain at the end of the procedure. If there are any concerns about pericardial oozing during the procedure, there is a low threshold to leave a pigtail drain in the pericardial space overnight and remove it the next day. The overall duration of this procedure was 3 hours and the patient remained in the hospital overnight for recovery. The patient has done well off antiarrhythmics since his ablation, without any recurrence.
Discussion
Mapping hemodynamically unstable VT can be challenging, but if performed systematically, localization of the critical isthmus can be obtained without the need for detailed activation or entrainment mapping. Another option is to use a hemodynamic support device or extracorporeal membrane oxygenation (ECMO). However, in our experience, these levels of hemodynamic support often add substantial time to the procedure, increase chances for vascular access complications, and require need for general anesthesia, which may limit inducibility of the clinical VT.
Percutaneous hemodynamic support devices have a role in VT ablation if substrate mapping and limited induction techniques are not successful.13 Muser et al established the PAINESD criteria as a risk score to identify patients at risk of acute hemodynamic compromise during VT ablation.14 Patients with a higher risk score should be considered for hemodynamic support during ablation.
We find that keeping patients awake during procedures can be a practical alternative to general anesthesia for sicker patients. It does require the partnership of an anesthesia provider who is comfortable with managing these complex procedures. There is the possibility that patients might move during the procedure, which risks shifting the map. The irregular respiratory patterns also pose a challenge for mapping and stability during ablation. One option is to keep the patient awake during the mapping and induction phase of the procedure, and keep them more sedated for the ablation portion. We also check arterial blood gas samples at baseline and approximately every hour to ensure the patient is not developing metabolic or respiratory acidosis. In advance of the procedure, any medications that might lower blood pressure are held for 24 hours. This allows the patient to have some permissive hypertension running into their procedure. Antiarrhythmics are also held for at least 2-7 days to maximize ability to induce VT.
Conclusion
Catheter ablation of VT is becoming increasingly popular as mapping and ablation technology have advanced to a point that these procedures can be done with a higher degree of safety and efficacy than ever before. LPs are a marker of discontinuous conduction across lines of functional or fixed block. These signals have been known to be important from the initial histologic specimens of postinfarction myocardium.15 As scar was surgically resected and electrically isolated, these LPs were found to disappear.16 High-density mapping catheters and advances in software have demystified regions of substrate once thought to be homogenous scar in prior years. Having the ability to see and annotate very low-voltage fractionated electrograms increases the understanding of fixed vs functional block and its role in the development of VT. Continued advances in the field will make VT ablation accessible to a wider range of patients.
Acknowledgements. We would like to acknowledge the Baylor Heart and Vascular Hospital EP lab staff and anesthesiologists, without whom these complex procedures would not be possible. We would also like to thank Kaitlin Kurth and the rest of the mapping team for being great partners during these ablations.
Disclosures: The author has completed and returned the ICMJE Form for Disclosure of Potential Conflicts of Interest. Dr Rao reports consulting fees and payment or honoraria for lectures, presentations, speakers bureaus, manuscript writing, or educational events from Abbott, Biosense Webster, and Medtronic.
References
1. Chugh S, Reinier K, Teodorescu C, et al. Epidemiology of sudden cardiac death: clinical and research implications. Prog Cardiovasc Dis. 2008;51(3):213-228. doi:10.1016/j.pcad.2008.06.003
2. Zipes D, Libby P, Bonow RO, Mann DL, Tomaselli GF, eds. Braunwald’s Heart Disease: A Textbook of Cardiovascular Medicine. 11th ed. Elsevier; 2018.
3. Tung R, Vaseghi M, Frankel DS, et al. Freedom from recurrent ventricular tachycardia after catheter ablation is associated with improved survival in patients with structural heart disease: an international VT ablation center collaborative group study. Heart Rhythm. 2015;12(9):1997-2007. doi:10.1016/j.hrthm.2015.05.036
4. Chaumeil A, Sacher F, Haïssaguerre M, Jaïs P. Epicardial approach in electrophysiology. In: Zipes D, Jalife J, Stevenson W (eds). Cardiac Electrophysiology: From Cell to Bedside. 7th Ed. Elsevier; 2018:1253-1262.
5. Aziz Z, Tung R. Novel mapping strategies for ventricular tachycardia ablation. Curr Treat Options Cardiovasc Med. 2018;20(4):34. doi:10.1007/s11936-018-0615-1
6. Papageorgiou N, Srinivasan N. Dynamic high-density functional substrate mapping improves outcomes in ischaemic ventricular tachycardia ablation: sense protocol functional substrate mapping and other functional mapping techniques. Arrhythm Electrophysiol Rev. 2021;10(1):38-44. doi:10.15420/aer.2020.28
7. Tung R. Substrate mapping in ventricular arrhythmias. Card Electrophysiol Clin. 2019;11(4):657-663. doi:10.1016/j.ccep.2019.08.009
8. Kitamura T, Martin CA, Vlachos K, et al. Substrate mapping and ablation for ventricular tachycardia in patients with structural heart disease: how to identify ventricular tachycardia substrate. J Innov Card Rhythm Manag. 2019;10(3):3565-3580. doi:10.19102/icrm.2019.100302
9. @DrRoderickTung. “Unmappable” VT mapped with strategic multielectrode positioning (StaMP mapping) at #ILAM decelzone. #ablateVT. September 4, 2019. Accessed June 27, 2022. https://twitter.com/drrodericktung/status/1169442639843926016
10. Tung R, Raiman M, Liao H, et al. Simultaneous endocardial and epicardial delineation of 3D reentrant ventricular tachycardia. J Am Coll Cardiol. 2020;75(8):884-897. doi:10.1016/j.jacc.2019.12.044
11. Jackson N, Gizurarson S, Viswanathan K, et al. Decremental evoked potential mapping: basis of a mechanistic strategy for ventricular tachycardia ablation. Circ Arrhythm Electrophysiol. 2015;8(6):1433-1442. doi:10.1161/CIRCEP.115.003083
12. Bhaskaran A, Fitzgerald J, Jackson N, et al. Decremental evoked potential mapping to guide ventricular tachycardia ablation: elucidating the functional substrate. Arrhythm Electrophysiol Rev. 2020;9(4):211-218. doi:10.15420/aer.2020.25
13. Miller M, Dukkipati SR, Chinitz JS, et al. Percutaneous hemodynamic support with Impella 2.5 during scar-related ventricular tachycardia ablation (PERMIT-1). Circ Arrhythm Electrophysiol. 2013;6(1):151-159. doi:10.1161/CIRCEP.112.975888
14. Muser D, Castro SA, Liang JJ, Santangeli P. Identifying risk and management of acute haemodynamic decompensation during catheter ablation of ventricular tachycardia. Arrhythm Electrophysiol Rev. 2018;7(4):282-287. doi:10.15420/aer.2018.36.3
15. De Bakker J, van Capelle FJ, Janse MJ, et al. Slow conduction in the infarcted human heart: ‘zigzag’ course of activation. Circulation. 1993;88(3):915-926. doi:10.1161/01.cir.88.3.915
16. Miller J, Tyson GS, Hargrove WC 3rd, et al. Effect of subendocardial resection on sinus rhythm endocardial electrogram abnormalities. Circulation. 1995;91(9):2385-2391. doi:10.1161/01.cir.91.9.2385