Essential Elements of an Electrophysiology Study: Decremental Ventricular Pacing
© 2024 HMP Global. All Rights Reserved.
Any views and opinions expressed are those of the author(s) and/or participants and do not necessarily reflect the views, policy, or position of EP Lab Digest or HMP Global, their employees, and affiliates.
EP LAB DIGEST. 2024;24(6):16-21.
Introduction
The atrioventricular (AV) junction introduces complexity to arrhythmia analysis. Without it, only junctional or ventricular rhythms would prevail. With it, a wide array of atrial and ventricular tachyarrhythmias exist, many only because this AV connection is involved in their mechanism. This discussion focuses on the AV junction.
The primary technique used to assess AV nodal function is decremental pacing, whether antegrade or retrograde, and it discloses 2 behaviors of AV nodal function. One is the limit of impulse input to the AV node and the other is reflected in the impulse’s transit time through the node. Decremental ventricular pacing (DVP) additionally discloses the presence of an accessory connection if present and when not apparent antegradely, as long as the relevant catheter is in the proper location to record impulse entry to the atria.
Understanding electrophysiologic testing is to understand how the AV node behaves, and this is best characterized by decremental pacing. Unlike the case for antegrade conduction, decremental ventricular pacing often discloses the answer to what we are looking for. A given pathway may not be available at all.
This article intends to help the reader understand how to anticipate what is going to be disclosed during DVP.
Discovering Retrograde Atrioventricular Routes
The electrophysiology study (EPS) is commonly used to diagnose a tachycardia mechanism and establish an ablation approach if appropriate. DVP plays a major role in the management of paroxysmal supraventricular tachycardia (PSVT) because it divulges the retrograde limb of the involved macroreentrant circuit. Two of the 3 forms of PSVT involve a macroreentrant mechanism and account for 90% of all PSVTs. The remaining 10% are “focal” and for which DVP provides no such insight.
Retrograde AV Conduction, Available Routes, and Their Prevalence
The prevalence of the fast and slow AV nodal pathways available antegradely and retrogradely were determined during routine EP testing among

100 patients ages 18-72.1 Patients with impaired AV nodal conduction were excluded and antiarrhythmic drugs were discontinued at least 5 half-lives prior to the EPS. Typically, by the time the EPS was started, conscious sedation was minimal. The prevalence of the fast and slow AV nodal pathways capable of retrograde conduction and their combinations are shown in the Table.
Ventriculoatrial (VA) conduction was present in nearly 90% of patients at baseline, largely accounted for by a fast AV nodal pathway (FP). Retrograde FP conduction, alone or in combination with a slow AV nodal pathway (SP), was available in 77%. Patients with retrograde conduction confined to a FP accounted for 41% of patients.
A retrograde SP was found among one-third of patients (30%), whether alone (4%) or in combination with a FP (retrograde dual AV nodal pathways, 26%). Eleven percent of patients exhibited absent VA conduction.
The Sequence of Pathway Failure During DVP
The most favorable condition for conduction through any pathway exists during sinus rhythm. As the pacing rate increases, conduction
progressively slows culminating in the loss of 1:1 VA conduction. The FP and SP rarely undergo block at the same cycle length. When progressing through DVP, the first pathway to fail is always the FP, followed by the SP if present. Typically, the last pathway to fail is an accessory pathway (AP), if present, because it has a higher safety factor for conduction.
The Process
• Begin the ventricular pacing cycle length (V1-V1 interval) 20 msec shorter than the sinus cycle length (SCL)
As the pacing cycle length (PCL) becomes shorter than the SCL, the rhythm will become ventricular paced. Absent VA conduction will become immediately evident by complete VA dissociation, as discussed below. When present, every V will be associated with an A, verified with calipers by noting that S1-S1 = V1-V1 = A1-A1 interval as long as the PCL is constant.
If VA conduction is absent in the baseline state, DVP should be repeated in the presence of isoproterenol to see if it develops. This is particularly important for the noninducible PSVT patient. About 25% of the time, a dormant SP can come to life with adrenergic influence, and this may uncover a potential clinical arrhythmia.
• Decrease (V1-V1) by 20 msec every tenth beat
DVP is carried out by uninterrupted decrementing of the PCL by 20 msec every tenth beat. Uninterrupted decrementing is important because conduction through the AV node is cycle-length dependent. If one interrupts the decrementing, instability in AV nodal conduction occurs resulting in unpredictable VA interval behavior.
During decrementing, observe that the V1-A1 interval lengthens as the V1-V1 interval shortens reflecting the normal AV nodal “decremental”
conduction behavior.
At each PCL, it will take several beats for the AV node to accommodate the new condition. This means that the V1-A1 interval will lengthen slightly, about 0-10 msec, during those initial beats, then stabilize and remain constant until the next shorter V1-V1 interval is initiated. If autonomic tone is unchanged, the V1-A1 interval should remain fixed during the latter half of the PCL. Therefore, only the last 2 or 3 paced beats of the train are relevant for making measurements.
During FP conduction, as the PCL associated with FP block is neared, the V1-A1 interval increases occur more rapidly. When there is no SP available, second-degree VA block results. In the presence of the SP, the minimum increase in the V1-A1 interval between 2 consecutive PCLs that reflects a jump to the SP is >25 msec.1 But, more importantly, the site of earliest retrograde atrial activation will dramatically change to a site near the coronary sinus (CS) os. This is the most telling feature of the shift from FP to SP. If the impulse maintains 1:1 conduction on the SP, continued V1-A1 interval lengthening returns to the smaller increments (0-10 msec) characteristic of a single-pathway transit.
• Endpoint: the loss of 1:1 conduction
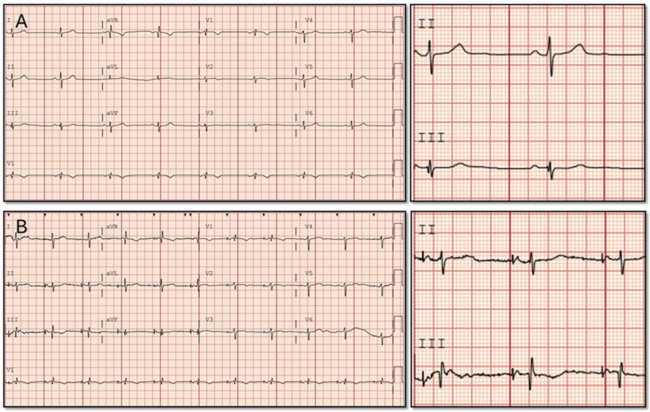
DVP ends upon the development of second-degree block, whether via the FP or SP. To recognize when that occurs, one need only focus on the V1 and RA tracings. Figure 1, during the early and mid-portions of DVP, shows the visual of a “V followed by an A.” When VA block occurs, as seen on the fourth beat, it is immediately recognizable by the missing A.
The Assessment of AV Nodal Function
Two principal features of AV nodal function emerge from DVP: the limit of impulse input to the AV node and the impulse’s limit in transit time through the AV node. These are 2 important recurring themes throughout the EPS also evident during decremental atrial pacing (DAP).
The Input Limit to the AV Node
Determining the limits of input to the AV node is to determine how fast one can deliver an impulse to the AV node and still get through it. Once the limit is reached or exceeded, the impulse blocks in the node with cessation of 1:1 VA conduction. There are 2 ways to record this limit:
• shortest V1-V1 interval associated with 1:1 VA conduction, or
• the longest V1-V1 interval associated with VA block.
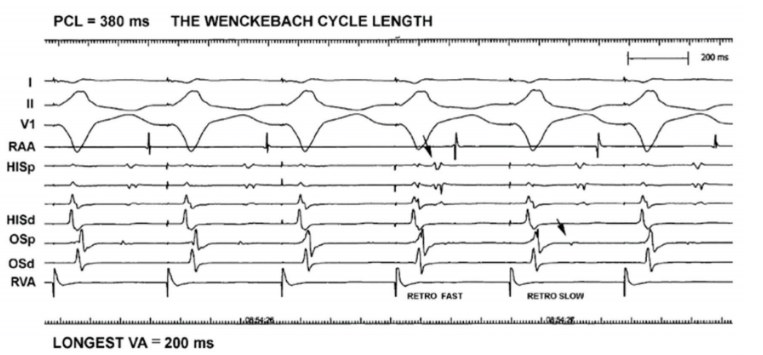
The second expression is more commonly used and referred to as the Wenckebach cycle length (WCL). The WCL range is fairly broad, about 300-550 ms, although more extreme values are possible. The WCL is fairly constant for a given patient but depends on the level of vagal or adrenergic tone at the time of its occurrence.
VA block at a relatively long PCL implies a degree of AV nodal impairment, whether due to a vagal or drug effect, or a previous valvular surgical
procedure affecting AV nodal conduction. In contrast, VA block at a very short cycle length implies excellent AV nodal conduction or might imply that retrograde conduction over a concealed AP is operative and should be sought. As a rule, the input limit for retrograde AV nodal conduction is reached at a slightly shorter PCL than that for antegrade AV nodal conduction, a good example of “asymmetry of conduction.”
During decremental pacing, when block in the AV node occurs, it does so via the phenomenon known as post-repolarization refractoriness, a “slow fiber,” Ca+2-dependent feature. The hallmark of block within the AV node is most easily appreciated by noting that the V1-A1 interval preceding block is at least 20 msec longer than that following block. This is referred to as a type I block pattern and it distinguishes AV nodal behavior from that of an AP, in which case, the 2 V1-A1 intervals are the same. This behavior also applies to antegrade AV nodal conduction.
The Transit Time Limit Through the AV Node
Transit time refers to the amount of time (msec) it takes for an impulse to traverse the AV node and is measured by the H1-A1 interval for any retrograde impulse. The H1-A1 interval is the opposite of the A1-H1 interval. During DVP, and with right ventricular outflow tract (RVOT) pacing in particular, retrograde activation of the His bundle can have similar timing with the local ventricular muscle surrounding it, thereby obscuring the His potential, making it difficult to measure an H1-A1 interval. This problem is obviated by using the V1-A1 interval in the His tracing, an equivalent transit time measurement.
The V1-A1 Interval as a Surrogate for the H1-A1 Interval
We have the option of pacing the ventricles from the RVOT or right ventricular apex (RVA) during DVP.
When measured in the His tracing, the V1-A1 interval is a reliable substitute for the H1-A1 interval when pacing from the RVA, but not always the RVOT.
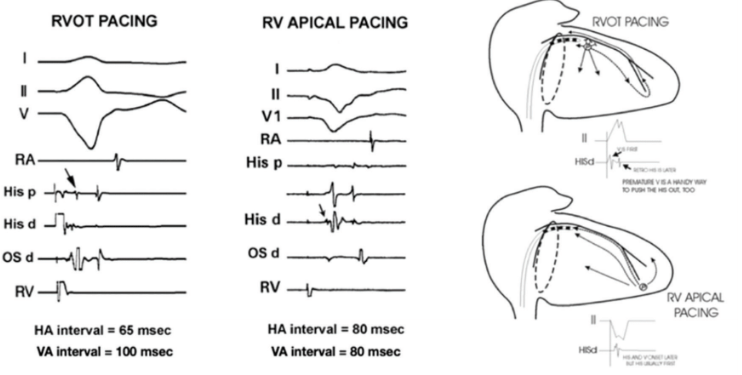
The left-hand panel of Figure 2 shows the activation sequences from 2 patients during RVOT pacing and, in the middle panel, during RVA pacing. The right-hand panel illustrates the paths taken by the paced impulse in each case.
During RVA pacing, impulse travel involves 2 different wavefronts (right-lower panel in Figure 2). Both ascend the septum, but one is strictly via septal muscle and the other is via the protected His-Purkinje system. The impulse traversing the specialized conduction system is confined to it and cannot directly activate the adjacent septal muscle due to its connective tissue sheath. As a result, the 2 wavefronts remain isolated from each other.
The His-Purkinje–directed impulse arrives at the His bundle area slightly earlier than that being delivered from ventricular muscle due to the former’s more rapid conduction. In the middle panel, an arrow highlights the His potential near the onset of the local V potential. Thus, during RVA pacing, the timing of V1 and H1 are very similar, enabling one to substitute the visible V1 for H1 and use the V1-A1 interval to measure retrograde AV nodal transit time. Close His bundle electrode spacing facilitates this resolution.
Intact His-Purkinje conduction must be present. Disease involving the distal His-Purkinje system may delay the appearance of the His potential, making it disappear into the ventricular potential.
Defining the Ranges of V1-A1 Intervals Associated With the FP and SP
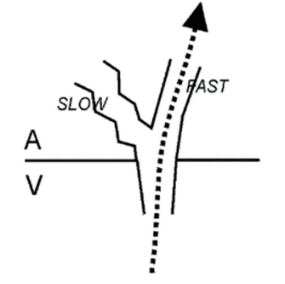
Acting as separate atrionodal inputs to the compact AV node the FP and SP provide for the AV junction’s Y-shaped anatomy, depicted in Figure 3.
From the perspective of a retrograde impulse, it enters one of 2 diverging paths if both are available. As soon as the impulse exits the AV node, an atrial electrogram is inscribed, ending the node’s transit time measurement. The FP delivers the earliest atrial activation near the apex of the triangle of Koch, in the position of the His catheter, and its corresponding V1-A1 intervals are <150 msec. With SP conduction, the impulse diverts to the region of the CS os, and with V1-A1 intervals >150 msec.
Transit time limits include:
• Longest FP V1-A1 interval: <150 msec
• Shortest SP V1-A1 interval: >150 msec
• Longest SP V1-A1 interval: >150 msec
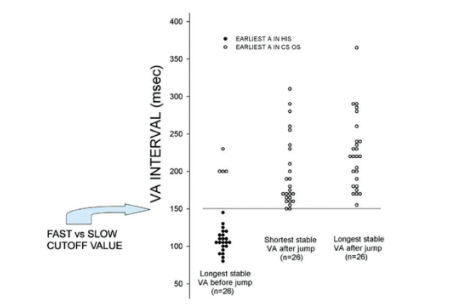
Figure 4 is a scatterplot of the transit time findings during DVP among 100 consecutive patients undergoing routine EP testing.1 FP V1-A1 intervals are shown as filled circles, while those of the SP are shown as open circles. The graph includes 26 patients (26%) with both an FP and SP along with 4 having only retrograde SP conduction.
Because the impulse is delivered to one of 2 anatomically separate RA insertion sites, the site of earliest retrograde atrial activation reflects the pathway being used. The FP delivers to the anterosuperior interatrial septum such that the earliest atrial activation is recorded in the His tracing. The SP delivers to the region surrounding the CS os where its earliest activation is found.
There was no overlap in the V1-A1 intervals between the FP and SP. The cutoff point was 150 msec: FP transit is <150 msec with the earliest timing in the His tracing; SP transit is >150 msec with the earliest timing in the CS os tracing.
All V1-A1 intervals preceding the pathway shift measured <150 msec except for the 4 patients (open circles) in whom only SP was present. That
these patients still exhibit a “jump” is consistent with the concept of multiple SPs. No V1-A1 interval <150 msec (filled circles) was associated with the earliest atrial activation in the CS os tracing. For all V1-A1 intervals >150 msec, the earliest activation was in the CS os region.
The 4 Patterns of Impulse Conduction Behavior During DVP
In the course of DVP, one can anticipate what will unfold. Impulse conduction behavior expresses itself in 4 ways leading up to second-degree VA block:
• Pattern I: 1:1 conduction remains on the FP until reaching VA block. SP absent. When second-degree VA block occurs, it typically persists as 2:1 second-degree VA block behavior, but Wenckebach periodicity can also be seen.
• Pattern II: Conduction shifts from FP to SP immediately before reaching VA block. This is the most common pattern and involves an “unstable” slow pathway, meaning 1:1 conduction cannot be maintained for more than a single cycle length, if not just a few beats, before undergoing SP block. In this setting, the SP manifests only during the WCL, and Mobitz I is the usual type of second-degree AV block.
• Pattern III: Conduction shifts from the FP to SP well before reaching VA block. This pattern involves a “stable” slow pathway capable of maintaining 1:1 conduction for at least one PCL, usually more. Autonomic tone may be an important factor enabling an impulse to linger on the slow pathway. Too much adrenergic influence lessens the trait of slower conduction, resulting in an earlier block than would be expected if vagal tone predominated. Pattern III is less common than Pattern II. When second-degree block is finally reached, Wenckebach behavior dominates. Wenckebach behavior can be confined to the SP, meaning that both the beat preceding and following the blocked beat are >150 msec and with a >20 msec difference.
• Pattern IV: Conduction is confined to the SP until VA block. This last pattern reflects retrograde SP conduction alone and is the least common, occurring in only 4% of patients. When VA block occurs, the pattern is usually 2:1, but Wenckebach can also be seen. In these patients, the earliest retrograde activation is always seen in the CS os region, and VA intervals always exceed 150 msec.
The data suggests that, as long as a single pathway is operative, whether FP or SP and irrespective of impulse direction, the pattern of 2:1 block is
more common than Mobitz I.
The information provided herein can make the EPS learning experience much easier by characterizing the expectations before any pacing has begun and allowing one to be better prepared to anticipate what to expect in the course of DVP.
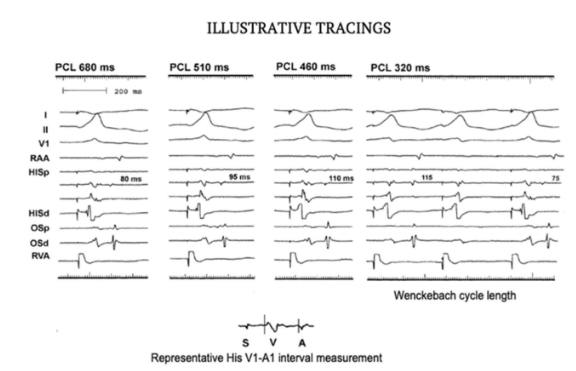
Illustrative Tracings
To review, a retrograde impulse shifts from FP to SP as an electrode pair located at or near the CS os. Pairing the site of earliest activation with the appropriate V1-A1 interval is paramount to declaring which route was taken.
The simplest form of retrograde AV nodal conduction behavior is via the FP (Figure 5). The atrial activation sequences and V1-A1 intervals are shown. DVP with steady-state 1:1 retrograde AV nodal conduction at 4 different PCLs, from 680 msec to 320 msec, is shown. Recordings from 4 intracardiac catheters are provided, including an octapolar His catheter and a quadripolar mapping/ablation catheter located in the CS os region. Each complex shown represents the tenth PCL beat.
As the PCL progressively decreases, the V1-A1 interval lengthens from 80 msec to 115 msec, reflecting “decremental” AV nodal conduction behavior.
Finally, note the typical Type I AV nodal behavior upon reaching second-degree block in the last panel. During the WCL, the V1-A1 interval preceding block is longer than the V1-A1 interval following block by >20 msec.
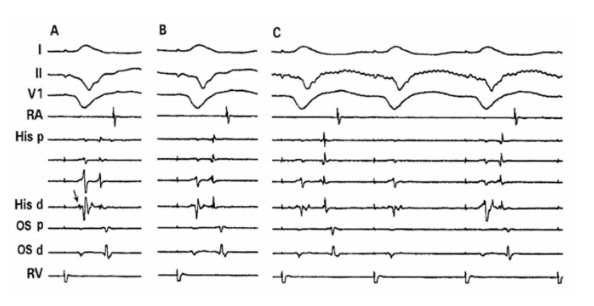
Pattern I: Isolated Retrograde FP Conduction
Figure 6 includes 3 panels, each showing a single-paced complex during RVA pacing and at 3 different PCLs. The octapolar His catheter provides
4 tracings and a quadripolar mapping/ablation catheter is in place at the CS os.
In panel A, the His potential is visible (arrow) in the His d recording slightly in advance of the ventricular electrogram’s onset: the V1-A1 interval = the H1-A1 interval, measuring 90 msec. In B, it has not changed. In C, at the WCL, the V1-A1 interval is 110 msec, the “longest obtainable V1-A1 interval.” The very next ventricular paced beat blocks and is followed by a shorter V1-A1 interval measuring 80 msec, consistent with a nodal mechanism of second-degree AV block. Based only on the value of the longest obtainable V1-A1 interval, one can conclude the patient only had a FP.
Pattern II: Retrograde FP + Unstable SP Conduction
Figure 7 illustrates the second pattern of retrograde conduction leading up to VA block. This involves a shift from FP to SP conduction, but one in which the SP is unstable and quickly fails.
Panels A-D represent 4 different PCLs, each progressively shorter. Four catheters are being used: RA, His, CS os, and RV. In panel A, at the longest PCL, the V1-A1 interval is the shortest. It is difficult to see the His catheter’s atrial electrogram on the proximal recording. It cannot be seen at all on the distal pair. One would have difficulty recognizing that the latest deflection is an atrial electrogram until the V1-A1 interval lengthening “pushes” it to the right, out of the way of the ventricular electrogram.
Note that in panels A-C, the atrial activation sequence indicates the His A to be earliest, and with VA intervals <150 msec, consistent with retrograde FP conduction.
Panel D is the WCL in which a shift to the SP occurs (beat #2) and has a V1-A1 interval value >150 msec, and a shift in the site of earliest atrial
activation to the region near the CS os. Block in the SP occurs in the next (third) beat followed by resumption of FP conduction in the fourth beat.
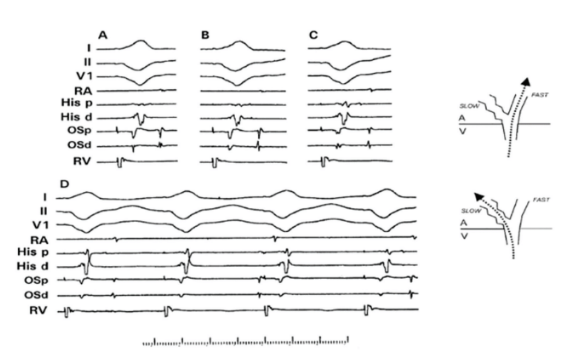
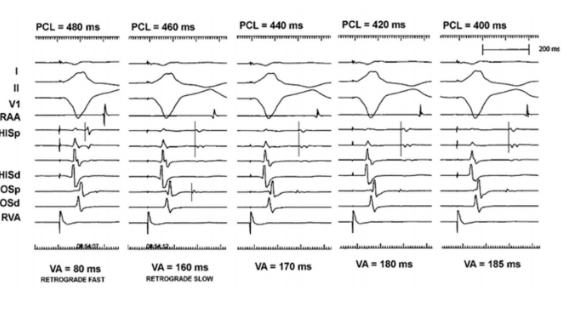
Pattern III: Retrograde FP + Stable SP Conduction
Figures 8 and 9 illustrate the third pattern of retrograde AV nodal pathway conduction. Five different ventricular PCLs are shown. The RV catheter is in the RVOT position (lead II is +). V1-A1 intervals are given.
At PCL 480 msec, the V1-A1 interval is 80 ms (<150 ms), with the earliest atrial activation in the His recording, consistent with FP conduction.
At PCL 460 msec, an abrupt change in both the V1-A1 interval and site of earliest activation can be seen: lengthening of the V1-A1 interval in the His recording to 160 ms (>150 ms) and a shift of earliest atrial activation to the CS os region. This represents a pathway shift from FP to the SP.
At all subsequent PCL down to 400 ms, conduction remains on the slow pathway: the V1-A1 interval continues to lengthen, but the earliest atrial activation remains at the os representing conduction over a stable SP.
Small (0-10 msec) increments in the V1-A1 interval during decrementing of the PCL typify impulse behavior over a given, single pathway, regardless of whether FP or SP.
Figure 9 shows findings at the WCL. As soon as this new PCL is reached, the loss of stability of the SP in maintaining the 1:1 conduction immediately becomes evident. The longest V1-A1 interval measures 200 msec. Block occurs with the third beat followed by resumption of FP conduction in the fourth (V1-A1 interval <150 msec, earliest A in His). The fifth beat jumps to the SP again (V1-A1 interval = 170 msec).
Regardless of the pattern of conduction leading up to second-degree block, the last conducted beat will always disclose whether a SP is present by its V1-A1 interval value: >150 msec SP present, <150 SP absent.
Pattern IV: Isolated Retrograde SP Conduction
Figures 10, 11, and 12 illustrate the fourth pattern of retrograde conduction in the patient with isolated retrograde slow AV nodal pathway
conduction. SP conduction is evident from the very first ventricular paced beat: early A in the CS os and a V1-A1 interval >150 msec.
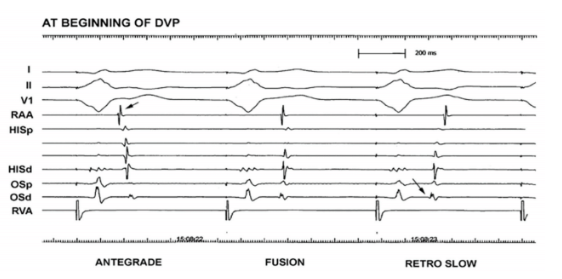
The first complex in Figure 10 exhibits absent VA conduction, an example of “interference dissociation.” Neither the ventricular nor the sinus impulse conducts through the AV node. Their near-simultaneous occurrence mutually excludes each other’s passage through the AV node, creating the momentary dissociated state. The atrial activation sequence is that of an antegrade impulse because the RAA egram precedes the His atrial egram.
The second-paced complex is followed by an unusual atrial activation sequence because early activation is evident at 2 sites, the RA and CS os, implying that a single pathway is not operative. While the RAA-His atrial egram sequence is consistent with antegrade activation, the timing of CS os atrial electrogram onset is also early and coincident with the RAA egram. This is an example of “fusion” between the antegrade and retrograde wavefronts.
The third-paced complex is the first to exclusively conduct retrograde, as evidenced by the RAA egram that follows the His atrial egram. The earliest atrial activation is at the CS os (second arrow) and coupled with a V1-A1 interval of 190 msec, reflecting retrograde SP conduction.
Figure 11 is from another patient at the beginning of DVP to show when atrial capture first becomes evident. Note that the paper speed is 150
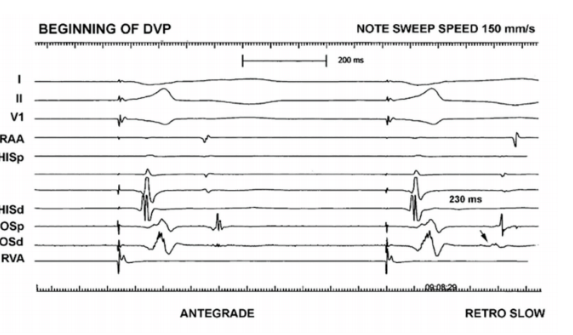
mm/sec, making the intervals appear longer compared with the usual 100 mm/sec.
The first ventricular paced beat is followed by an antegrade sinus impulse. It is antegrade because the RAA egram precedes the His atrial egram.
The second ventricular paced beat captures the atria because its activation sequence is “retrograde” (His atrial egram timing precedes the RAA egram). The combination of a long V1-A1 interval (>150 ms) with earliest atrial activation in the CS os is consistent with travel over the SP.
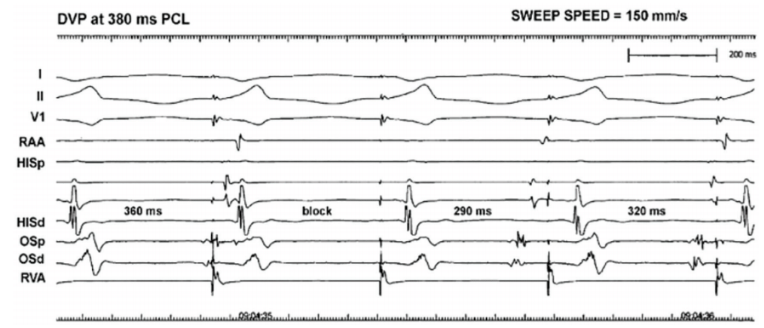
Figure 12 represents the WCL at 380 msec. Because the atrial electrograms exhibit so much delay via the SP, their timing is closer to the next ventricular paced complex and this can initially create some confusion. The first-paced complex’s V1-A1 interval is longer than that of the third-paced complex (following block) when conduction resumes, consistent with a “nodal” site of block. This case also illustrates the occurrence of Wenckebach conduction confined to the SP.
Absent VA Conduction
Eleven percent of patients have no available retrograde route for impulse conduction in the baseline state, accounting for the finding of absent VA conduction.
The ventricular PCL is initiated with a CL slightly shorter than the sinus. Rather than seeing the atria develop any relationship with the ventricular paced beats, AV dissociation is observed instead: the P waves just march through the QRS complexes (Figure 13).
Since the sinus and ventricular paced rhythms are not synchronous and have different rates, their timing relationship changes. Intermittently, the timing relationship between A and V aligns in such a way that antegrade conduction of the sinus beat is reassociated with the ventricles. This produces a “capture” beat.
If the ventricular rhythm is slow enough, the sinus impulse may have a better chance to capture the ventricles and may produce a narrow QRS
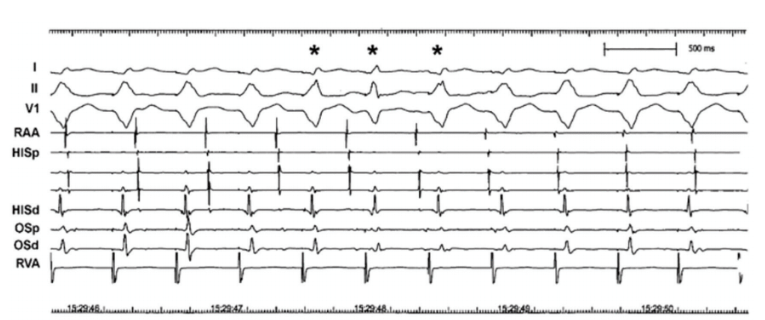
complex; when the ventricular CL is shorter, the captured ventricular beat may coincide with a paced ventricular beat, resulting in “fusion” of the two. The 3 beats labeled with an asterisk denote such fusion. The fusion in the first and third beats is more subtle (note lead II QRS morphology difference) than in the second.
Fusion beats always arise from capture in the setting of DVP, but not all capture beats are narrow. Capture and fusion are unequivocally diagnostic of AV dissociation.n
Disclosure: The author has completed and returned the ICMJE Form for Disclosure of Potential Conflicts of Interest, and reports no conflicts of interest regarding the content herein.
References
1. Moulton K. Selective ablation of the slow AV nodal pathway: evolving concepts in atrioventricular nodal anatomy and physiology. In: Huang SK (ed). Radiofrequency Catheter Ablation of Cardiac Arrhythmias: Basic Concepts and Clinical Applications. Futura Publishing Company, Inc.; 1994:205-228.
2. Langendorf R, Cohen H, Gozo EG Jr. Observations on second degree atrioventricular block, including new criteria for the differential diagnosis between type I and type II block. Am J Cardiol. 1972;29:111-119. doi:10.1016/0002-9149(72)90426-2
Related Content